| ||||||||||||||||||||||
All 39 seats to Stevenage Borough Council 20 seats needed for a majority | ||||||||||||||||||||||
|---|---|---|---|---|---|---|---|---|---|---|---|---|---|---|---|---|---|---|---|---|---|---|
| ||||||||||||||||||||||
 Map showing the results of contested wards in the 1979 Stevenage Borough Council elections. | ||||||||||||||||||||||
| ||||||||||||||||||||||
The 1979 Stevenage Borough Council election took place on 3 May 1979. This was on the same day as other local elections. The entire council was up for election and the Labour Party retained control of the council.
Overall results
| Party | Seats | Gains | Losses | Net gain/loss | Seats % | Votes % | Votes | +/− | ||
|---|---|---|---|---|---|---|---|---|---|---|
| Labour | 35 | 89.7 | 46.5 | 19,218 | ||||||
| Conservative | 4 | 10.3 | 37.3 | 15,406 | ||||||
| Liberal | 0 | 0 | 16.2 | 6,712 | ||||||
| Total | 39 | 41,336 | ||||||||
| Labour hold | ||||||||||
Ward results
Bandley Hill (3 seats)

Location of Bandley Hill ward
| Party | Candidate | Votes | % | ||
|---|---|---|---|---|---|
| Labour | J. Lloyd | 1,714 | |||
| Labour | A. Luhman | 1,639 | |||
| Labour | B. Dunnell | 1,601 | |||
| Conservative | L. Jordan | 1,160 | |||
| Conservative | D. Dix | 1,087 | |||
| Conservative | M. Tate | 963 | |||
| Liberal | D. Clark | 598 | |||
| Turnout | 77.6% | ||||
| Labour win (new seat) | |||||
| Labour win (new seat) | |||||
| Labour win (new seat) | |||||
Bedwell Plash (3 seats)

Location of Bedwell Plash ward
| Party | Candidate | Votes | % | ||
|---|---|---|---|---|---|
| Labour | H. Lawrence | 1,710 | |||
| Labour | W. Lawrence | 1,695 | |||
| Labour | D. Cullen | 1,642 | |||
| Conservative | A. Bradley | 1,103 | |||
| Conservative | M. Henry | 1,063 | |||
| Conservative | D. Thomas | 1,036 | |||
| Liberal | P. Roberts | 425 | |||
| Turnout | 75.6% | ||||
| Labour win (new seat) | |||||
| Labour win (new seat) | |||||
| Labour win (new seat) | |||||
Chells (2 seats)

Location of Chells ward
| Party | Candidate | Votes | % | ||
|---|---|---|---|---|---|
| Labour | J. Clarke | 1,414 | |||
| Labour | K. Vale | 1,303 | |||
| Conservative | A. Bunting | 903 | |||
| Conservative | D. Brown | 892 | |||
| Liberal | M. Reynolds | 373 | |||
| Turnout | 80.2% | ||||
| Labour win (new seat) | |||||
| Labour win (new seat) | |||||
Longmeadow (3 seats)

Location of Longmeadow ward
| Party | Candidate | Votes | % | ||
|---|---|---|---|---|---|
| Labour | J. Tye | 1,363 | |||
| Labour | W. Sheaff | 1,349 | |||
| Labour | A. Greenslade | 1,298 | |||
| Conservative | H. Gladwin | 1,285 | |||
| Conservative | B. Reid | 1,284 | |||
| Conservative | M. Stannard | 1,205 | |||
| Liberal | E. Brook | 653 | |||
| Turnout | 79.1% | ||||
| Labour win (new seat) | |||||
| Labour win (new seat) | |||||
| Labour win (new seat) | |||||
Martins Wood (3 seats)

Location of Martins Wood ward
| Party | Candidate | Votes | % | ||
|---|---|---|---|---|---|
| Labour | R. Clark | 1,286 | |||
| Labour | D. Weston | 1,261 | |||
| Labour | K. Wilkinson | 1,216 | |||
| Conservative | E. Hegan | 1,211 | |||
| Conservative | M. Stelling | 1,211 | |||
| Conservative | N. Sampath | 1,097 | |||
| Liberal | K. Taylor | 641 | |||
| Turnout | 79.8% | ||||
| Labour win (new seat) | |||||
| Labour win (new seat) | |||||
| Labour win (new seat) | |||||
Mobbsbury (3 seats)

Location of Mobbsbury ward
| Party | Candidate | Votes | % | ||
|---|---|---|---|---|---|
| Labour | J. Gotobed | 1,225 | |||
| Labour | J. Graham | 1,138 | |||
| Conservative | B. Hancock | 1,118 | |||
| Labour | J. Turnock | 1,095 | |||
| Conservative | K. Clewer | 1,043 | |||
| Conservative | F. Lasenby | 992 | |||
| Liberal | D. Roberts | 470 | |||
| Turnout | 81.8% | ||||
| Labour win (new seat) | |||||
| Labour win (new seat) | |||||
| Conservative win (new seat) | |||||
Monkswood (3 seats)

Location of Monkswood ward
| Party | Candidate | Votes | % | ||
|---|---|---|---|---|---|
| Labour | L. Cummins | 1,082 | |||
| Labour | K. Hopkins | 1,030 | |||
| Labour | A. Wiltshire | 975 | |||
| Conservative | D. Eaton | 702 | |||
| Conservative | B. Lavers | 673 | |||
| Conservative | R. Kent | 670 | |||
| Liberal | G. Robbins | 320 | |||
| Turnout | 78.9% | ||||
| Labour win (new seat) | |||||
| Labour win (new seat) | |||||
| Labour win (new seat) | |||||
Old Stevenage (3 seats)
Location of Old Stevenage ward
| Party | Candidate | Votes | % | ||
|---|---|---|---|---|---|
| Conservative | J. Boyd | 1,834 | |||
| Conservative | W. Boyd | 1,787 | |||
| Labour | H. Morris | 1,624 | |||
| Labour | K. Stutley | 1,596 | |||
| Labour | R. Green | 1,483 | |||
| Conservative | J. Briscoe | 1,259 | |||
| Liberal | S. Booth | 587 | |||
| Turnout | 81.7% | ||||
| Conservative win (new seat) | |||||
| Conservative win (new seat) | |||||
| Labour win (new seat) | |||||
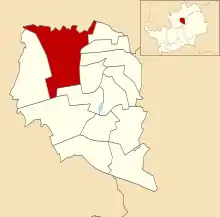
Pin Green (3 seats)

Location of Pin Green ward
| Party | Candidate | Votes | % | ||
|---|---|---|---|---|---|
| Labour | K. Taylor | 1,425 | |||
| Labour | R. Smith | 1,373 | |||
| Labour | A. Campbell | 1,366 | |||
| Conservative | K. McKechnie | 1,173 | |||
| Conservative | A. Hurst | 1,126 | |||
| Conservative | O. Welch | 1,111 | |||
| Liberal | L. Atkins | 521 | |||
| Turnout | 80.6% | ||||
| Labour win (new seat) | |||||
| Labour win (new seat) | |||||
| Labour win (new seat) | |||||
Roebuck (3 seats)
Location of Roebuck ward
| Party | Candidate | Votes | % | ||
|---|---|---|---|---|---|
| Labour | J. Cockerton | 1,322 | |||
| Conservative | A. Walker | 1,204 | |||
| Labour | S. Munden | 1,165 | |||
| Labour | E. Baker | 1,143 | |||
| Conservative | E. Wignall | 1,123 | |||
| Conservative | F. Schofield | 1,118 | |||
| Liberal | M. Boutell | 432 | |||
| Turnout | 82.6% | ||||
| Labour win (new seat) | |||||
| Conservative win (new seat) | |||||
| Labour win (new seat) | |||||
St Nicholas (3 seats)

Location of St Nicholas ward
| Party | Candidate | Votes | % | |
|---|---|---|---|---|
| Labour | T. Corner | 1,355 | ||
| Labour | B. Beasley | 1,282 | ||
| Labour | R. Fowler | 1,156 | ||
| Conservative | W. Dehany | 937 | ||
| Conservative | A. Dehany | 925 | ||
| Conservative | S. Woods | 867 | ||
| Liberal | I. Hargreaves | 514 | ||
| Turnout | 76.0% | |||
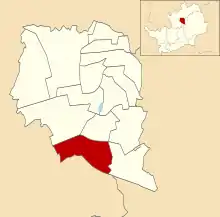
Shephall (3 seats)

Location of Shephall ward
| Party | Candidate | Votes | % | ||
|---|---|---|---|---|---|
| Labour | B. Hall | 1,465 | |||
| Labour | S. Greenfield | 1,464 | |||
| Labour | I. Johnson | 1,412 | |||
| Conservative | A. Mann | 845 | |||
| Conservative | C. Aylin | 721 | |||
| Conservative | F. Warner | 714 | |||
| Liberal | G. Reynolds | 462 | |||
| Turnout | 75.8% | ||||
| Labour win (new seat) | |||||
| Labour win (new seat) | |||||
| Labour win (new seat) | |||||
Symonds Green (3 seats)

Location of Symonds Green ward
| Party | Candidate | Votes | % | ||
|---|---|---|---|---|---|
| Labour | M. Cotter | 1,563 | |||
| Labour | G. Balderstone | 1,552 | |||
| Labour | L. Robbins | 1,461 | |||
| Conservative | G. Hook | 1,450 | |||
| Conservative | P. Nightingale | 1,427 | |||
| Conservative | J. Scarratt | 1,423 | |||
| Liberal | V. Bartlett | 541 | |||
| Turnout | 76.2% | ||||
| Labour win (new seat) | |||||
| Labour win (new seat) | |||||
| Labour win (new seat) | |||||
Wellfield (1 seat)

Location of Wellfield ward
| Party | Candidate | Votes | % | ||
|---|---|---|---|---|---|
| Labour | C. Corner | 670 | |||
| Conservative | P. Jenkins | 481 | |||
| Liberal | L. Peal | 175 | |||
| Turnout | 78.6% | ||||
| Labour win (new seat) | |||||
References
| Metropolitan boroughs |
|
|---|---|
| District councils (England) |
|
| District councils (Wales) |
|
| Referendums | |
This article is issued from Wikipedia. The text is licensed under Creative Commons - Attribution - Sharealike. Additional terms may apply for the media files.