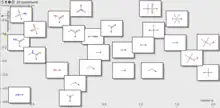
Craig plot showing values of Hansch pi and Hammett sigma constants for 26 common organic substituents
The Craig plot, named after Paul N. Craig, is a plot of two substituent parameters (e.g. Hansch-Fujita π constant and sigma constant) used in rational drug design.[1]
Two most used forms of a Craig plot are
- plotting the sigma constants of the Hammett equation versus hydrophobicity
- plotting the steric terms of the Taft equation against hydrophobicity
See also
References
- ↑ "IUPAC glossary". Archived from the original on 2006-12-09. Retrieved 2006-12-14.
Further reading
- Craig, Paul N. (1971). "Interdependence between physical parameters and selection of substituent groups for correlation studies". Journal of Medicinal Chemistry. 14 (8): 680–684. doi:10.1021/jm00290a004. PMID 5114063.
This article is issued from Wikipedia. The text is licensed under Creative Commons - Attribution - Sharealike. Additional terms may apply for the media files.